A Little R: Reviewing ggplot2 Basics
I just finished up a certificate in Learning Analytics, wherein most of my courses used the programming language R. My vision of my identity prior to these course was certainly not one of “a computer person” or a “coder” — not even a little bit. So there was definitely a pretty steep learning curve for me to get through these courses, especially at first. Now, having completed the program, I have a goal to review my R skills to solidify my knowledge and be a bit more independent in applying what I’ve learned to research projects of personal interest to me. (BTW, if you were feeling like the previous sentence was a little wordy, I’m here to tell there was no little about it: that puppy had 37 words. I could have edited it, but I thought maybe we could just experience it together. Sitting with discomfort, I realize, is a theme of this post.)
As such, I decided to try to work my way—langorously—through R for Data Science by Hadley Wickham (how fun is this?) and Garrett Grolemund. And yes, I’m old, so I got an actual book. (They’re made of trees! No, really. It’s crazy!) There is obviously also lots of information online.
I have to say that looking at fairly basic material again after going through these courses is like seeing the information with glasses on. Before it was all a blur. Now, suddenly, things are in focus. There’s a funny note in the first few pages of this book: “As you start to run R code, you’re likely to run into problems” (p.13). I think I laughed out loud when I read this. My experience of learning R was one of confronting constant problems (philosophical side note: Life may actually also be constant problems—like one after another—and the expectation for it to be otherwise could be the actual source of unhappiness…not the problems…anyways, just a thought.)
In the beginning, I had some deep and dark feelings about encountering all this difficulty. It reinforced my ideas about myself as not good at math (buried Calculus trauma), not good with computers, not good with technology…ya know, just not all that bright or capable. Over time, though, I began to see it really differently. The more problems I encountered, the more problems I overcame, the more confident I became in my ability to troubleshoot. I don’t know, maybe there’s some sort of life lesson there: It’s not about not having problems, it’s about having confidence in one’s ability to gather resources—internal, external, extraterrestrial, whatever—to overcome them.
Anyways, we’re getting deep here, and really I just wanted to share what I worked on today. Like my dissertation dispatches, I hope sharing “a little R” here on my blog will help me stay accountable to my goal of practicing and also maybe provide some information, insight, or inspiration to someone else who feels less than confident with R (or some other equally daunting task that “isn’t you” (YET) but is gonna be once you show it who’s boss)
ggplot2
Chapter 1 of R for Data Science starts with basic data visualization with ggplot2. Data viz is not something I feel particularly adept at, so this is a great place for me to start my review.
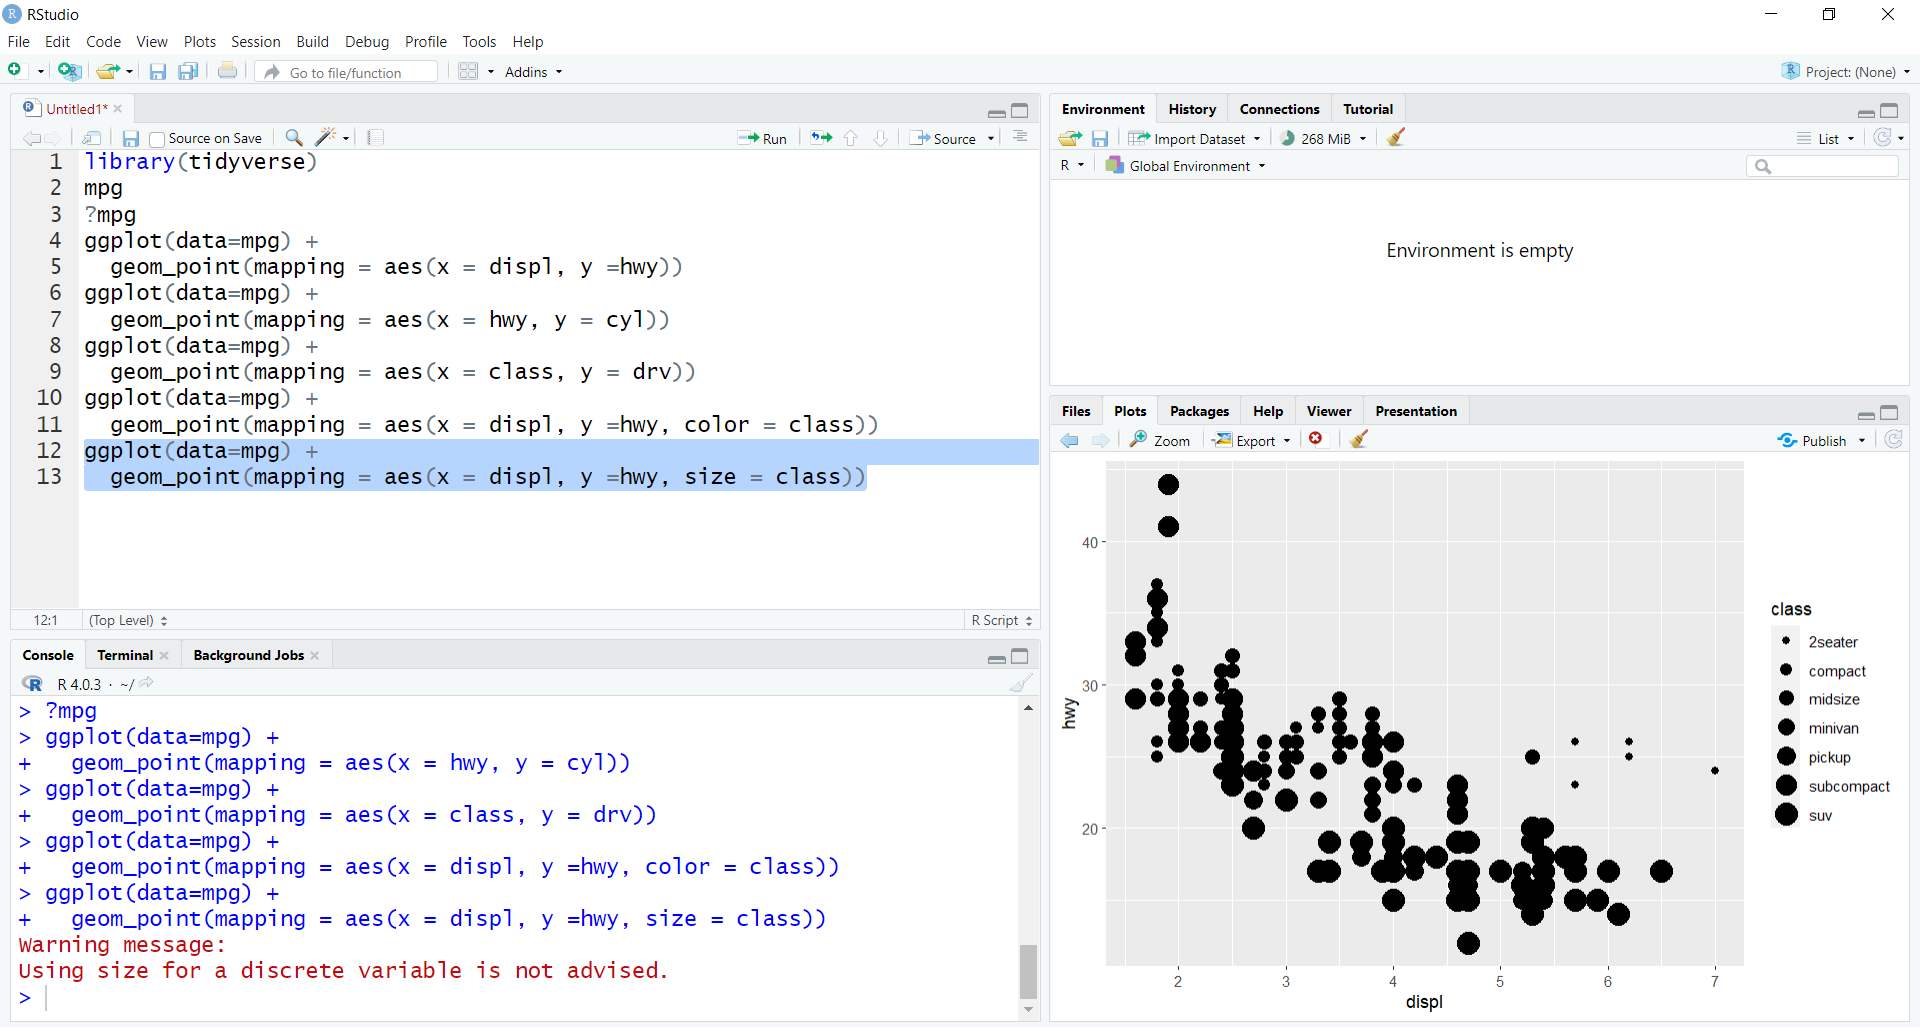
Working in RStudio, I did some of the basic exercises in the first part of the chapter, using the “mpg” data set that comes with R. (There are a few data sets that come with R and which are helpful for practice). This was also a good review of the aesthetic mappings that work for certain types of data.
After doing the basic practice, I wanted to try applying it to a different data set. I chose a csv file (a spreadsheet) I’d created for a literature review I did a few semesters ago. The lit review looked at how mothers use technology to promote their own agency. This was a really interesting project, and many of the themes that surfaced were surprising to me. It was also quite interesting to see how international the (small) mix of papers was, and how global (and persistent) expectations of intensive mothering (Hays, 1998) are. Finally, I was surprised/not surprised on the near absence of literature looking at women’s development after motherhood. This lack fits perfectly with intensive motherhood ideals, wherein a mother subordinates herself to her child. (My personal take on this is that it goes against decades of evidence that good circumstances for mothers are mutually beneficial for both mothers and children. This is also refuted in a prominent recent research study (Pinho-Gomes, Peters, & Woodward, 2023) showing that improved conditions for women—particularly in low income countries—improves life expectancy for women and men.) It’s interesting, though, how sharply the intensive mothering ethos is reflected in the research world too.
It took a bit of exploration to remember how to change the labels in the legend, to which I am indebted to this statology.org page. After reflecting on my graph and my readings of the articles, I thought it might be interesting to capture wealth of first author nations —not data I collected before: Are the themes different based on the wealth of the country of origin? Another finding that was quite interesting to me was the the theme of assisted reproductive technology. This wasn’t something that was even on my “technology radar” before I did this review.
Below is the code I used to make this data visualization with some annotations that I hope are helpful.


